

| 일 | 월 | 화 | 수 | 목 | 금 | 토 |
|---|---|---|---|---|---|---|
| 1 | 2 | 3 | ||||
| 4 | 5 | 6 | 7 | 8 | 9 | 10 |
| 11 | 12 | 13 | 14 | 15 | 16 | 17 |
| 18 | 19 | 20 | 21 | 22 | 23 | 24 |
| 25 | 26 | 27 | 28 | 29 | 30 | 31 |
- CM-EF-NEX
- VirtualBox #VMware
- x99 itx/ac
- Oh My Zsh #macOS
- Laptop #CPUID
- 다이슨 #배터리
- Dell #Latitude #BIOS
- 피코프레소 #ITOP40
- XTU #Virtual Machine System
- fat32 #rufus
- k6 #피코프레소
- Arduino #PlatformIO #macOS
- 매크로렌즈 #리버스링
- cycloidal #rv reducer
- VNC #Firewall #CenOS7 #VMware
- TensorFlow #Python #pip
- Xeon #E5-2680
- Java #MacBook #macOS
- Octave #homebrew #macOS
- Linux #VirtualBox
- Tarantula #3D 프린터
- razer #deathadder #viper #g102
- VMware #Shared Folder
- centos7 #yum update #/boot
- Callaway #Mavrik #Epic Flash
- Arduino #Wall Plotter
- ESP32 #Arduino
- egpu #aorus gaming box #gtx1070 #tb3
- ITOP40
- macro lens #EF #FD
- Today
- Total
얕고 넓게
[PC] AI용 PC 부품 비교 본문
2025.01.24
CPU
https://www.cpubenchmark.net/compare/5299vs4993vs5008vs5060/AMD-Ryzen-7-7800X3D-vs-Intel-i5-13500-vs-Intel-i5-13600K-vs-Intel-i7-13700K
×AMD Ryzen 7 7800X3D×Intel Core i5-13500×Intel Core i5-13600K×Intel Core i7-13700K+ ADD
| Price | $449 - BUY | $252.55 - BUY | $223.29 - BUY | $329 - BUY | |
| Socket Type | AM5 | FCLGA1700 | FCLGA1700 | FCLGA1700 | |
| CPU Class | Desktop | Desktop | Desktop | Desktop | |
| Clockspeed | 4.2 GHz | 2.5 GHz | 3.5 GHz | 3.4 GHz | |
| Turbo Speed | Up to 5.0 GHz | Up to 4.8 GHz | Up to 5.2 GHz | Up to 5.4 GHz | |
| # of Physical Cores | 8 (Threads: 16) | 14 (Threads: 20) | 14 (Threads: 20) | 16 (Threads: 24) | |
| Cache | L1: 512KB, L2: 8.0MB, L3: 96MB | L1: 1,248KB, L2: 11.5MB, L3: 24MB | L1: 1,248KB, L2: 20.0MB, L3: 24MB | L1: 1,408KB, L2: 24.0MB, L3: 30MB | |
| TDP | 120W | 65W | 125W | 125W |
GPU
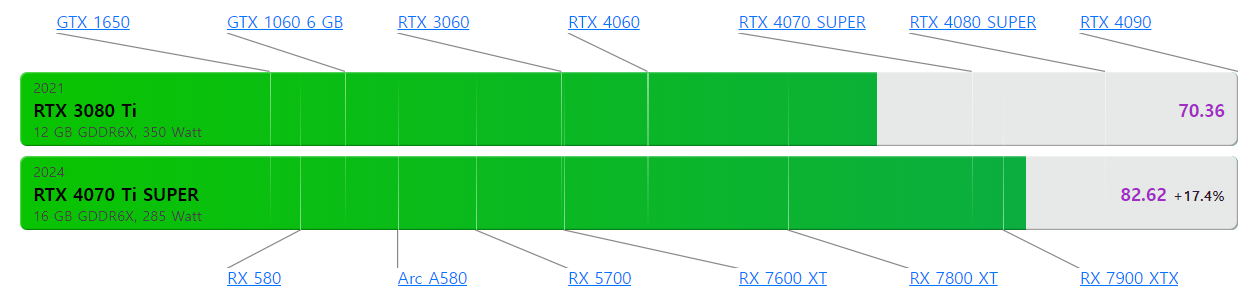
3080Ti vs 4070 Ti Super
https://technical.city/en/video/GeForce-RTX-3080-Ti-vs-GeForce-RTX-4070-Ti-SUPER
RTX 4070 Ti SUPER vs RTX 3080 Ti [5-Benchmark Showdown]
3DMark 11 is an obsolete DirectX 11 benchmark by Futuremark. It used four tests based on two scenes, one being few submarines exploring the submerged wreck of a sunken ship, the other is an abandoned temple deep in the jungle. All the tests are heavy with
technical.city
| Pipelines / CUDA cores | 10240 | 8448 |
| Core clock speed | 1365 MHz | 2340 MHz |
| Boost clock speed | 1665 MHz | 2610 MHz |
| Number of transistors | 28,300 million | 45,900 million |
| Manufacturing process technology | 8 nm | 5 nm |
| Power consumption (TDP) | 350 Watt | 285 Watt |
| Texture fill rate | 532.8 | 689.0 |
| Floating-point processing power | 34.1 TFLOPS | 44.1 TFLOPS |
| ROPs | 112 | 96 |
| TMUs | 320 | 264 |
| Tensor Cores | 320 | 264 |
| Ray Tracing Cores | 80 | 66 |
3090 vs 4060Ti
https://technical.city/en/video/GeForce-RTX-3090-vs-GeForce-RTX-4060-Ti
RTX 4060 Ti vs RTX 3090 [1-Benchmark Showdown]
This is the most ubiquitous GPU benchmark. It gives the graphics card a thorough evaluation under various types of load, providing four separate benchmarks for Direct3D versions 9, 10, 11 and 12 (the last being done in 4K resolution if possible), and few
technical.city

| Pipelines / CUDA cores | 10496 | 4352 |
| Core clock speed | 1395 MHz | 2310 MHz |
| Boost clock speed | 1695 MHz | 2535 MHz |
| Number of transistors | 28,300 million | 22,900 million |
| Manufacturing process technology | 8 nm | 5 nm |
| Power consumption (TDP) | 350 Watt | 160 Watt |
| Texture fill rate | 556.0 | 344.8 |
| Floating-point processing power | 35.58 TFLOPS | 22.06 TFLOPS |
| ROPs | 112 | 48 |
| TMUs | 328 | 136 |
| Tensor Cores | 328 | 136 |
| Ray Tracing Cores | 82 | 34 |
'IT > PC' 카테고리의 다른 글
| [PC] Cinebench r23 @Precision 7530 (2025.02.04) (0) | 2025.02.04 |
|---|---|
| [PC] Cinebench r23 결과 @Mac mini (m2) (0) | 2025.01.26 |
| [PC] LoL @Mac mini (m2, 8 Core, 10 GPU, 16GB) (0) | 2025.01.18 |
| [PC] Precision 7530 다시보기 (0) | 2025.01.16 |
| [PC] oh-my-posh 설치 (0) | 2025.01.13 |


